
Most AI content ROI reports count hours saved and stop there. A draft that takes 40 minutes instead of four hours looks like a clear win on a spreadsheet. The spreadsheet never asks whether anyone finished reading the piece, trusted it, or clicked anything afterwards.
I think that’s the wrong place to stop, and this article is about where to look next. It sets out a way to compare one brief produced two ways, AI-only and AI-human hybrid, and judge both on trust signals as well as cost. One thing up front: this piece contains no results table. Any figures here would have to come from a completed, real test with real traffic, and presenting invented numbers as a case study would defeat the point of measuring trust at all. What follows is the method, the hypotheses it tests, and the limits you should state when you publish your own results.
Hours saved is not ROI: the number most AI content reports skip
Time saved is a cost metric. It tells you what a workflow spares you, and nothing about what it earns. Two workflows can cost the same and perform very differently, and two workflows that perform the same can cost very differently. Judging by cost alone only works if you assume the output is identical.
That assumption is the weak spot. If an AI-only draft contains a wrong claim, a generic example or a tone that makes readers leave, the hours you saved were spent on something that underperforms. If a human edit adds two hours but doubles the number of readers who click through to a next step, the edit paid for itself. You can’t know which situation you’re in without measuring something beyond production time.
This is the gap between an AI content workflow that saves time (I’ve covered how to build one that saves 20 hours a week) and AI content marketing ROI. The first is about production. The second asks what each workflow returns once readers meet the page. A defensible ROI case needs both columns: what it cost and what it earned, with trust signals standing in for earnings where revenue is too slow or too sparse to measure.
For aspiring marketers, this matters beyond theory. If you’re asked to justify using AI to a client, an employer or your own audience, “it’s faster” is the weakest argument available. Evidence that the output holds up with readers is the one that survives a follow-up question.
The setup: one brief, two workflows, same publishing conditions
The design is simple. Take one approved brief: a topic, a target keyword, an audience, an outline and a target length. Produce it twice.
Workflow A, AI-only. The brief goes into an AI writing tool, and the output is published with formatting fixes only: headings, links, spelling. No fact-check, no rewrites, no added examples.
Workflow B, hybrid. The same brief and the same tool produce a first draft. A human then checks every factual claim, rewrites weak sections, adds specific examples the tool couldn’t know, and removes anything that sounds generic. Editorial accountability sits with the person, not the tool.
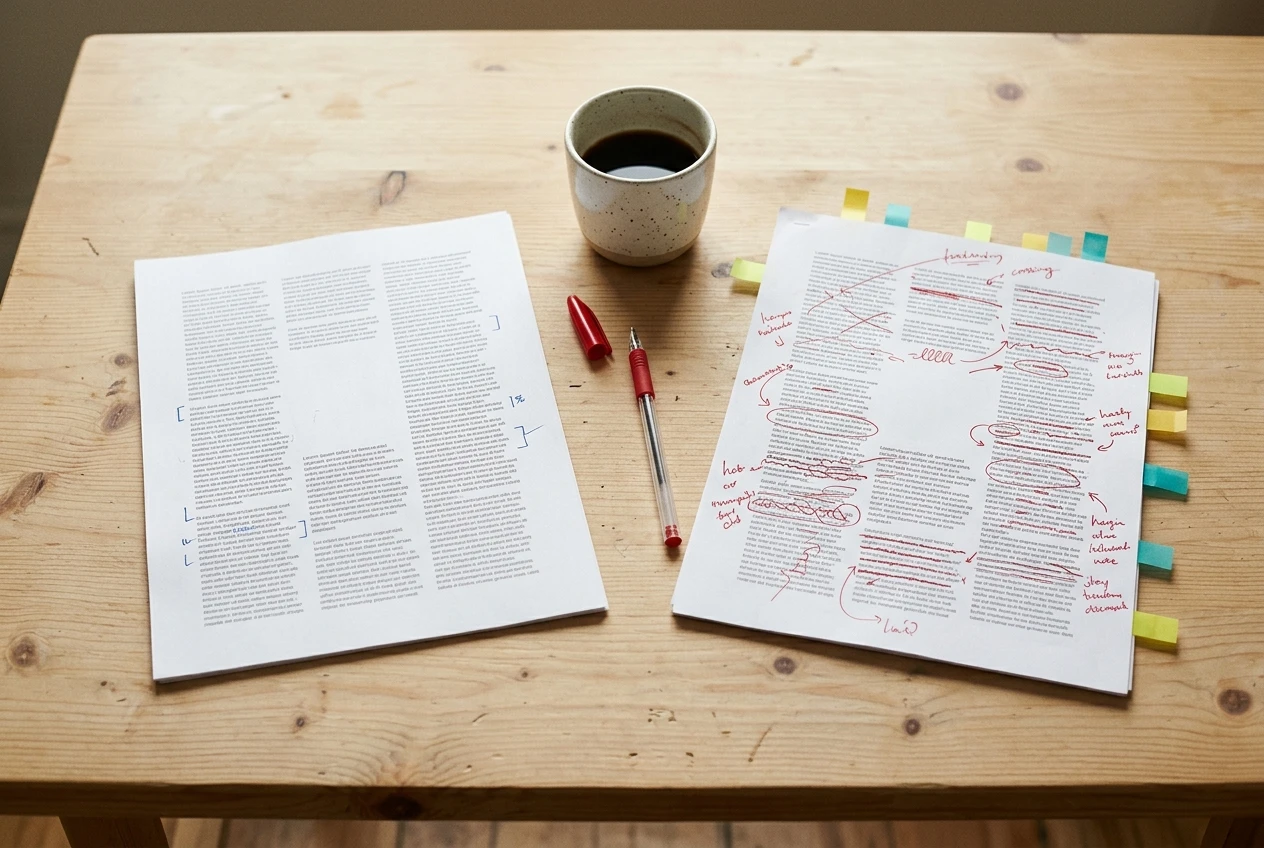
Keeping the brief identical is what makes the comparison fair. Everything else you can control, you should hold constant: word count, headline style, number and position of links, and the next step you want readers to take.
The hard part is publication. Two near-identical pages on the same site are likely to compete with each other in search, and showing the same article twice to the same audience muddies the result. There are three workable ways around this:
- Split an email list at random. Send half the segment version A and half version B, each linking to a hosted page or sent in the email itself. Randomising matters, because choosing the segments yourself builds your bias into the result.
- Use an A/B testing tool on one URL. Visitors see one version or the other at the same address, so search engines see a single page.
- Publish on two equivalent topics. This is weaker, because topic difficulty and demand become variables. Use it only if the other two aren’t available, and say so when you report.
Publishing conditions matter too. Same day of the week, same promotion (or none for both), same time slot. If version A gets a social push and version B doesn’t, you’ve measured the social push.
What counts as trust, and how to measure each signal
“Trust” is too vague to measure directly, so the test uses four signals that readers’ behaviour can approximate. None is perfect. Together they’re more informative than any one alone.
Engagement quality
Page views say a reader arrived. Engagement quality says what they did there. Look at how far down the page readers scroll, how long they stay relative to the article’s length, and whether they go on to a second page. Use the figures your analytics tool already reports, and record the definition it uses, since tools differ in what counts as an engaged session.
Compare the two versions on the same measures. A page with a high bounce rate and a short stay is telling you something different from a page where people read to the end and leave. Note which one you’re seeing before drawing conclusions.
Reader feedback
This covers comments, replies, emails and direct messages. It’s the signal with the smallest numbers, so it’s the one most likely to mislead if you treat it statistically, but it’s also the richest. One reader saying “this example didn’t match my situation” can explain a pattern the analytics only hint at.
To get more than a trickle, add a single-question prompt at the end of both versions, such as “Did this answer your question?” with yes, partly and no. Keep the wording identical. Record the number of responses alongside the split, because 3 of 4 saying yes is not the same evidence as 300 of 400.
Accuracy corrections
This is the signal most AI comparisons never include, and it’s the most concrete. Count it in two places:

- Before publication. Fact-check both drafts line by line against sources. Log each claim that was wrong, unsupported or unverifiable, with a severity note: minor wording issue, misleading, or plainly false.
- After publication. Log every correction a reader reports, and every correction you make yourself after going live.
The pre-publication count for version A shows how much checking the AI-only workflow would have needed. The post-publication count shows what actually reached readers. For a publication whose editorial standard is that factual claims must be verifiable, this number matters more than most engagement metrics.
Click-through to a next step
Pick one next step that’s identical on both pages and in the same position: a link to a related guide, a newsletter signup, a service page. Then measure the share of readers who clicked it. This is the closest the test comes to measuring whether readers trusted the page enough to keep going with you.
Use click-through rate, not click count, so a difference in traffic doesn’t distort the result.
Cost
Cost needs the same care. Count the tool subscription or usage cost, but also the human time: the first-draft prompting, the fact-check, the rewrite, the formatting. Put a value on your own hours, even a rough one, or the hybrid will look free and the comparison will be rigged in its favour. Then calculate cost per reader who clicked the next step for each version. That single figure joins the two columns.
Where an AI-only version is most likely to lose readers
Without results, this section has to be a set of hypotheses. They’re informed by how AI-written drafts commonly behave, and each can be checked against the signals above. Treat them as predictions your test can confirm or contradict.
Hypothesis 1: generic examples lower engagement quality. AI tools tend to reach for examples that could apply to anyone. If that holds, version A should show earlier exits partway down the page, particularly at sections built on illustrations rather than claims.
Hypothesis 2: unverified claims raise the correction count. A draft that states specifics (a statistic, a date, a feature of a tool) without sources is a draft that will contain some wrong ones. If that’s right, version A should log more pre-publication errors, and some may slip through to readers if nobody checks.
Hypothesis 3: sameness lowers click-through. If the article reads like many others on the topic, readers have little reason to follow you to the next page. Version A should show a lower click-through rate on the next step, even if its early engagement looks fine.

Hypothesis 4: the loss is quiet. A reader who finds a page generic rarely writes to say so. They leave. That’s why reader feedback alone would probably miss the problem, and why behaviour measures need to sit beside it. If your test shows version A performing about the same as version B on every signal, that’s a result too, and a useful one: it would mean the human edit isn’t earning its cost for that kind of content.
The point of listing these is that you commit to them before seeing any data. Predictions written afterwards always fit.
What the human edit is meant to change in the hybrid version
The hybrid workflow adds specific human actions, and it helps to name them, because “human oversight” is too vague to evaluate. For the test, log what the editor actually did to the draft:
- Fact-checked claims. How many were changed or removed?
- Replaced examples. How many generic illustrations were swapped for specific ones the editor knew about or sourced?
- Cut sections. What was removed because it added nothing?
- Voice changes. Where was the tone adjusted to match the publication?
- Added judgement. Where did the editor add an opinion, a recommendation or a caveat the tool wouldn’t have offered?
That log is your explanation layer. If version B outperforms version A on click-through, the log is how you suggest why. If it doesn’t, the log shows whether the edit was too light to matter. A light edit and a heavy one are different treatments, and lumping them together as “hybrid” would hide that.
The edit itself is a craft with identifiable steps, and I’ve written about why AI-written content fails and the edit that fixes it. This article asks a different question: once you’ve made that edit, does it earn back its cost? That’s the part most workflows never measure.
What a test like this can’t prove, and what to distrust in any case study
A comparison like this is useful, but it has limits, and you should publish them alongside your results.
One topic is one data point. A result on a how-to article says little about a product review or an opinion piece. Different content types may respond differently to the same edit.
Small samples produce noisy numbers. If each version gets a few hundred visitors, a difference of a few percentage points in click-through can easily be chance. Report the raw counts next to any percentage, and avoid language like “proved” or “significantly better” unless you’ve done the statistics properly.
You know which is which. Once you’ve seen the results, it’s easy to read the human-edited version as better. If you can, have someone who doesn’t know the workflow score both drafts for quality before the data comes in.
The hybrid costs more by design. If it wins, the question is whether it wins by enough. That’s why cost per next-step click sits at the end of the method and not only the engagement numbers.
Editor skill is a variable. A strong editor and a rushed one produce different hybrids. Your result describes your editor on that day, not hybrid workflows in general.
Novelty and traffic source can skew everything. If one version drew its readers from a different place, you’re comparing audiences.
Hold any published case study to the same standard. I’d distrust one that reports only percentage improvements without the number of readers behind them, ignores the human time the hybrid workflow takes, comes from a company selling the tool being tested, or reports a single run with no repeat. A case study that states its limits plainly is more believable than one that doesn’t, because it shows the author looked for ways to be wrong.
How to run your own AI-only versus hybrid comparison before you scale
Here is the method as a checklist you can run on one page.

- Choose one brief. Pick a topic you can fact-check and a page with a clear next step.
- Write your hypotheses first. Note what you expect on each of the four signals, and what result would change your mind.
- Produce both versions. Same tool, same brief. Version A gets formatting fixes only. Version B gets a full human edit.
- Log the work. Record the time each took, tool costs, and every edit made to B.
- Fact-check both drafts. Count errors in each before publishing, even the one you plan to publish unedited. Record them, so the data exists.
- Split your audience randomly. Use an email split or an A/B tool, and give both versions identical conditions.
- Set a fixed measurement window. Decide in advance how long you’ll collect data, such as two weeks, and don’t stop early because one version looks ahead.
- Report counts, not only rates. Show how many readers saw each version, how many clicked, how many replied and how many corrections came in.
- State the limits. One topic, one editor, small numbers: whatever applies, say it.
- Repeat once. A second run on a different brief tells you more than a more detailed analysis of the first.
If after all that the numbers are thin, say so and present the method. Thin data honestly reported is still worth publishing. Invented data isn’t worth anything, and readers who spot it will discount everything else you’ve written.
Run it and send me what you find
Take one of your own pages and run the two-workflow comparison. It doesn’t need a big audience; it needs honest logging. When you have your numbers, send me what you find, including the parts that didn’t go the way you expected. Those are usually the most useful.
If you’d rather have a second pair of eyes on AI-assisted content before you test or publish it, I offer trust audits that review accuracy, voice and the places where a reader is most likely to stop trusting a page.
For the next read, see how to use AI without losing credibility, which covers the practices that make a hybrid workflow worth measuring. No affiliate tools are mentioned in this article, so there are no affiliate links to disclose.